PowerPoint’s Interactive Slides: From Static Decks to Explorable Explanations

Writer

A chart can show where revenue changed. An interactive chart lets the audience ask which product, region, or period explains the change without leaving the slide. A diagram can label a system. An interactive diagram lets someone select a component and inspect its role while keeping the whole system in view.
That is the useful shift behind Create interactive slide in Copilot for PowerPoint: not simply more animation, but a different relationship between the audience and the information. The slide becomes something people can explore.
Microsoft documents the capability as a way to generate clickable visual explanations, including dashboards and timelines, from a natural-language request. The compelling question is not whether a slide can look impressive. It is whether interaction makes the subject easier to understand. Microsoft’s interactive-slide documentation explains the supported experience and its boundaries.
The mental model: an explorable explanation, not a connected application
Think of an interactive slide as a small, self-contained explanatory experience inside a presentation. Instead of placing every detail on the canvas at once, it can reveal information as the viewer selects a category, moves through a sequence, or adjusts a control.
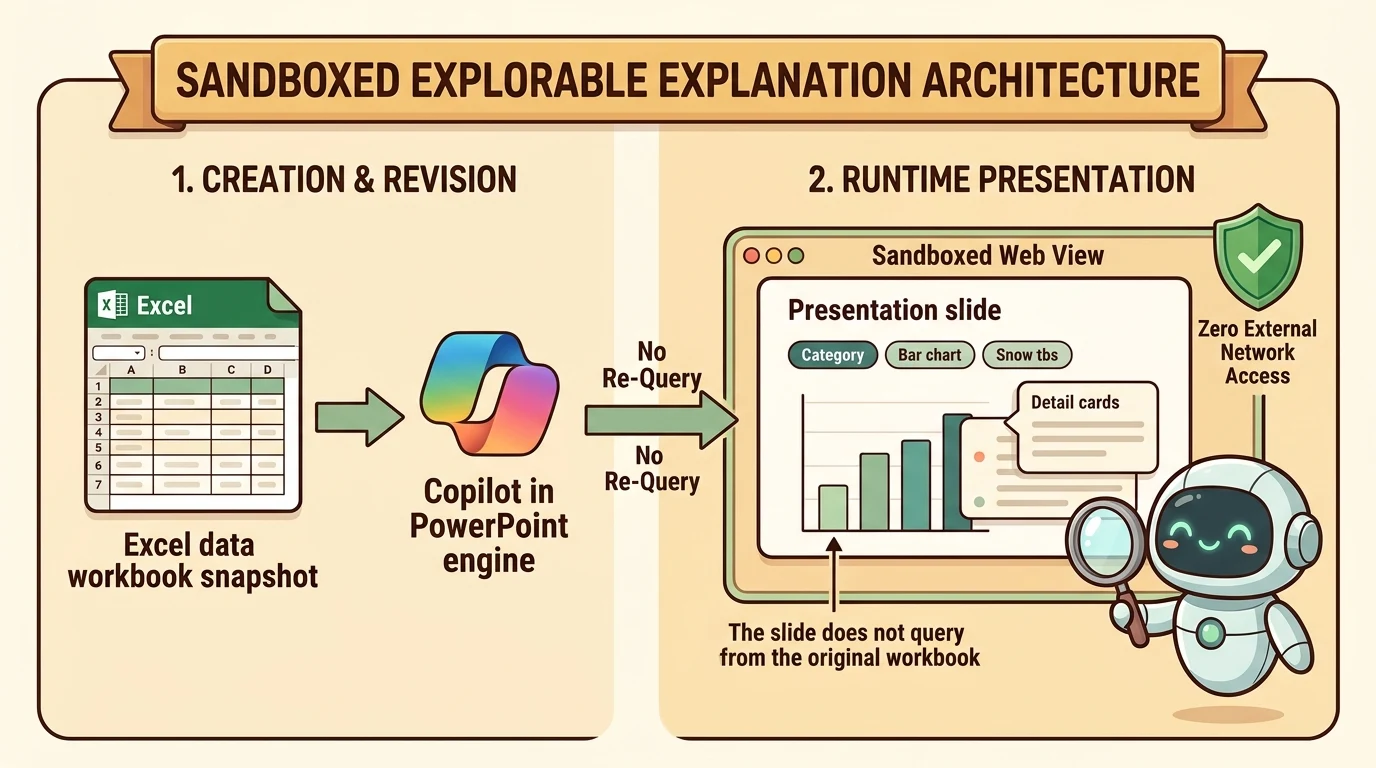
The technical boundary matters. Microsoft says interactive slides use sandboxed web views to display their content and provide interaction. Those web views do not connect to other content or services. The same documentation describes a workbook-based dashboard as using a snapshot of Excel data. Source: architecture and grounding
This separates two stages that are easy to confuse:
- Creation and revision: Copilot can use work content to generate or update the slide.
- Exploration: The generated slide presents its content through a sandboxed interactive experience.
A filter changing a chart is not evidence that the slide has queried the original workbook again. Nor does a polished dashboard establish that it is a live reporting application.
Treat an interactive slide as an explorable explanation of its supplied content, not as a live connection to the underlying business system.
The application analogy is useful for understanding controls and local behavior. It stops being useful when it suggests external integrations, persistent workflows, or continuously refreshed data that the documented feature does not provide.
What is available, and who can use it?
As of October 26, 2026, Microsoft’s support documentation describes rollout of the skill and ribbon button beginning in mid-October and expected to complete by the end of October for PowerPoint on Windows and Mac in Current Channel and Monthly Enterprise Channel, and for PowerPoint on the web. It also identifies earlier access through Frontier and specified preview channels. That is more precise than assuming every installation already has the feature. Source: rollout and supported versions
The source demonstration describes the feature as generally available and requiring Copilot Premium. Microsoft’s documentation gives a broader eligibility statement: interactive slides are available to eligible consumer and commercial users who already have access to Copilot in PowerPoint, including Microsoft 365 Copilot Basic and Premium, with no separate interactive-slide license. Recipients can explore a shared presentation’s interactivity without a Copilot license. For eligibility, use the official documentation rather than the narrower wording of a demonstration. Source: licensing
Creation, viewing, and export are different capabilities:
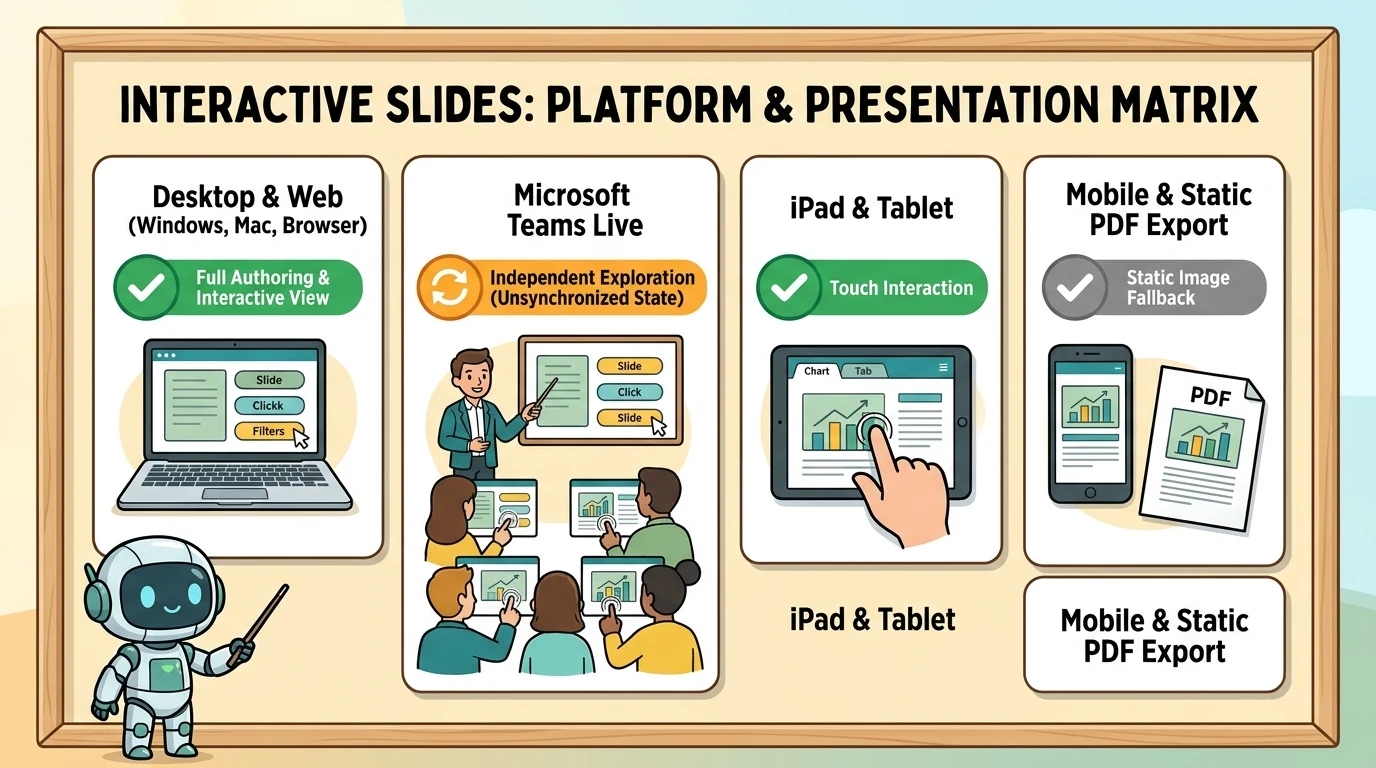
| Environment | Documented experience |
|---|---|
| Copilot app; PowerPoint on Windows, Mac, and web | Create or update using the skill, and interact with slides |
| PowerPoint on iPad | Interact with slides |
| PowerPoint Live in Microsoft Teams | Attendees can interact independently |
| PowerPoint on iPhone and Android | Non-interactive image |
| Printing and export to formats such as PDF | Non-interactive image |
Microsoft recommends current supported releases for the best viewing experience. Consequently, “viewers do not need Copilot” should not be rewritten as “every PowerPoint version supports interaction.” Source: platform support
Two entry points, one creation workflow
Microsoft documents two ways to start:
- Select Interactive Slide from the Home or Insert ribbon, then describe the desired result in the Copilot pane.
- Select Create interactive slide from Copilot’s skill picker. Source: creation workflow
The demonstration shows ribbon categories for Summary, Dashboard, Timeline, Comparison, and Custom. These are useful starting points for the narrative, not a guarantee that every requested behavior will be generated correctly. The ribbon opens the Copilot workflow; the substantive design still comes from the request and its source content.
A skill is a reusable, instruction-based capability that gives Copilot task-specific guidance. Microsoft documents selecting skills through the + menu and Choose skills, or invoking them with an @mention. It also documents managing skills through the Copilot settings menu. Interface wording may differ from the demonstration’s “manage plugins and skills” label. Source: PowerPoint skills
For this feature, the important distinction is straightforward: the skill supplies the task guidance; the prompt specifies what this particular slide should explain.
Start with the question, then choose the interaction
“Make this interactive” can produce an interesting result. It is a weak specification, however, because it leaves the purpose of the interaction unstated.
A better design starts with the question the audience should be able to answer.
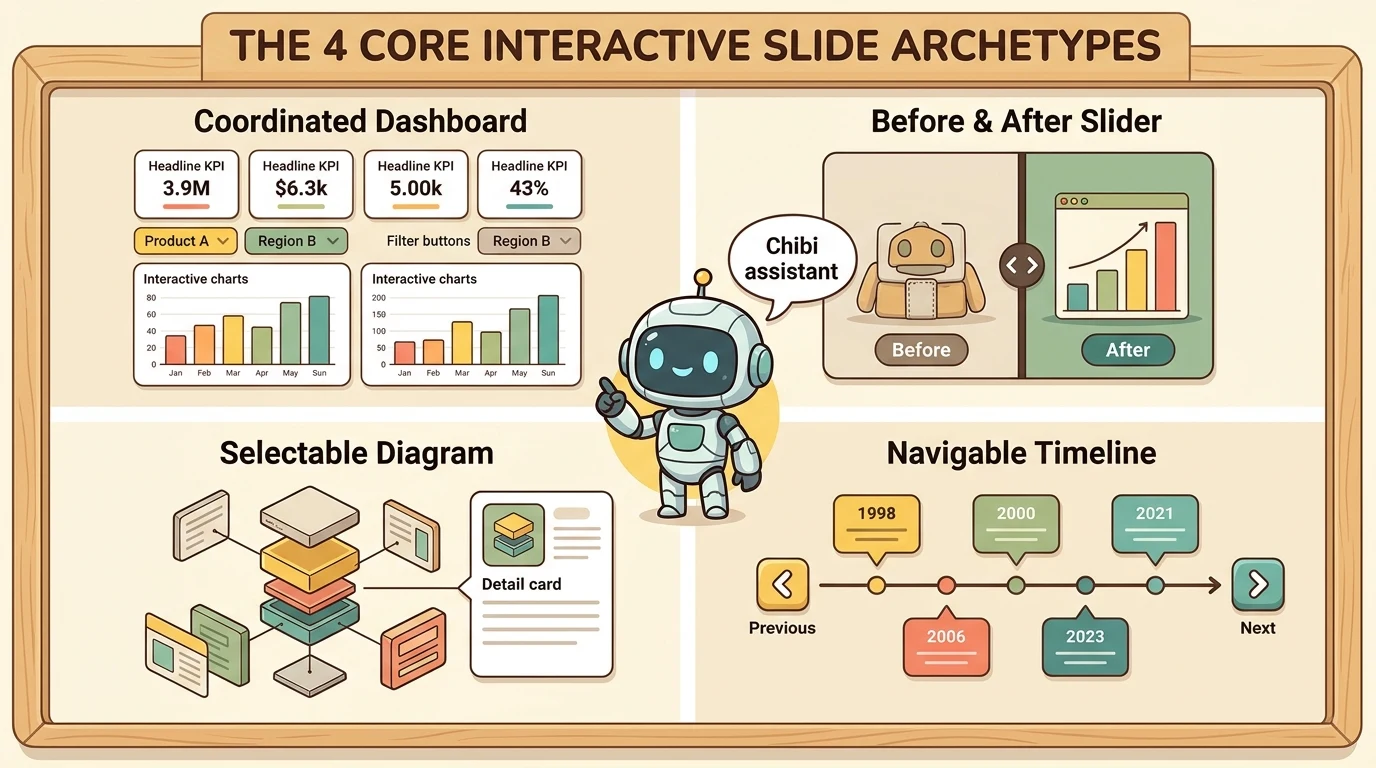
| Audience question | Useful interaction pattern |
|---|---|
| What changes when I select another segment? | Filters with coordinated charts and details |
| What changed between two versions? | Before-and-after slider |
| What does this component do? | Selectable diagram with a detail panel |
| What happened next? | Timeline with previous and next controls |
| How do these options differ? | Comparison tabs with consistent criteria |
| What happens when an input changes? | Parameter controls with an explanatory output |
These are design recommendations drawn from the demonstrated examples, not a catalog of guaranteed outputs. Their common purpose is to let the audience investigate a relationship while retaining enough context to understand it.
Dashboards: connect the headline to the underlying segment
The demonstration begins with a financial workbook containing a summary, income statement, balance sheet, and cash-flow information. Copilot turns it into a dashboard with headline metrics, filterable charts, tooltips, and selectable insights.
The valuable pattern is coordinated exploration. A viewer should be able to select a product or metric and see the chart, detail panel, and explanatory text respond consistently.
The same pattern appears in the funnel example: selecting a customer segment, channel, or offering changes the displayed funnel and accompanying analysis. Buyer-persona examples switch between share of buyers and share of spending, making the distinction between those measures visible.
These examples illustrate a presentation technique. Their displayed percentages and financial figures are not benchmarks or independently verified business results. See the source demonstration.
For your own data, a useful starting request is:
Create an interactive dashboard from the supplied workbook snapshot. Show the headline metrics supported by the source and add product and period filters where those fields exist. Keep charts and explanatory text consistent with the selected filters. Preserve the source units and distinguish totals from percentages. Do not invent missing values. Match the presentation’s theme.
This is an illustrative prompt, not a guarantee of output. The requirement to preserve units and avoid invented values must still be checked afterward.
Sliders: make a visual difference inspectable
The room-design example uses a movable divider to compare an empty room with furnished versions, plus style selectors and autoplay. The salmon example applies a similar reveal pattern to external and internal anatomy.
The design lesson is not simply “add a slider.” It is keep the reference frame stable while revealing the difference. If two images have inconsistent perspective or alignment, the control may be attractive but the comparison becomes misleading.
For an illustrative room-design request, specify the same viewpoint across variants, clearly named styles, and an optional autoplay mode. For anatomy, prioritize accurate structures and labels over visual drama. Generated illustrations need subject-matter review before they become teaching material.
Selectable diagrams: preserve the whole while explaining the part
The mountain-bike example combines an assembled view, an exploded view, component selection, and a detail panel. Selecting a frame, shock, saddle, wheel, or brake changes the explanatory content without losing the larger product context.
The same interaction pattern appears in the demonstration’s Work IQ, Dataverse, and Copilot-related diagrams. Their value is the relationship between the overview and the selected element, not merely replacing text with hover effects. Those examples do not independently verify the product architecture or terminology shown in them.
For a technical diagram, an illustrative request could be:
Create an interactive explanation of the components described in this deck. Keep an overview visible and show a detail panel when a component is selected. Use only relationships and specifications supported by the source. Match the deck’s colors and terminology. Include speaker notes explaining the intended walkthrough.
The demonstration shows generated speaker notes and use of deck context. Microsoft also documents grounding interactive slides in work content through Work IQ and refining their appearance to match a theme. That does not establish that every relevant detail in a large deck will be extracted correctly. Source: grounding and refinement
Timelines, agendas, and comparisons: organize detail around a stable structure
A timeline turns a long chronological list into selectable events. The demonstration’s fictional company history adds previous and next controls, letting the audience inspect an era without displaying every event simultaneously.
An interactive agenda applies a related idea to a large presentation: organize the deck’s topics, release information, and availability details into a navigable overview. A searchable language directory makes a dense list easier to explore through filters and examples. These are demonstrated patterns, not assurances that generated release dates, licensing classifications, or translations are correct.
Comparison slides work best when every option uses the same criteria. For a model comparison, that might mean use case, reasoning behavior, speed, and price. However, the source transcript’s model labels are not sufficient evidence of actual OpenAI model identities or capabilities. They should not become a factual comparison without independently verifying the models and their current documentation.
The broader rule is simple: interaction improves access to information; it does not authenticate that information.
Educational examples: explain a mechanism, not just a picture
The demonstration extends beyond business presentations into message transmission, phone charging, geometry, standard deviation, equation exploration, and a historical march toward Moscow. The shared idea is to let the learner inspect a sequence or change an input instead of watching a fixed explanation. Source demonstration
Different subjects need different checks:
- Message transmission: make the assumed network path explicit. A simplified animation should not imply that every message follows the same route.
- Phone charging: distinguish an illustrative model from a validated prediction of charging time. A wattage selector alone does not establish physical accuracy.
- Geometry: verify that each step follows from the stated construction and that labels remain consistent.
- Standard deviation: check whether the example uses a population or sample formula, and whether changing points updates the result correctly.
- Equation libraries: validate formulas, notation, units, and domains of applicability. A large catalog is not evidence of correctness.
- Historical timelines or maps: verify dates, locations, quantities, and causal explanations against reliable historical sources.
These are recommended review criteria, not claims that the demonstrated slides passed those checks. Likewise, a butterfly animation illustrates creative breadth, not scientific validation.
The strongest educational slide lets someone answer “what changes, and why?” A control that changes a visual without explaining the relationship risks becoming decoration.
Refinement happens through Copilot, not ordinary canvas editing
Microsoft explicitly states that interactive slides are created and updated through Copilot rather than by directly editing the slide. Keep the Copilot pane open and request changes such as a different chart type, an additional filter, or theme-matched colors. Source: editing model
That changes the review loop. A practical approach is:
- Generate a small, focused first version.
- Check the source facts and intended interaction.
- Request one clearly scoped revision.
- Retest both the changed behavior and the original content.
For example: “Keep the existing metrics and layout. Add a region filter only if the workbook contains that field. Ensure the headline totals and chart use the same selection.”
This is a recommended working method, not a product guarantee that revisions will preserve every other element. Microsoft warns that AI-generated layout, content, and behavior can contain inaccuracies or unexpected results. Source: accuracy limitations
Presenting and sharing: the audience may not see your state
PowerPoint Live in Teams has an important behavior: attendees can interact independently, but interactions are not shared. They do not see the presenter’s or other attendees’ interaction state. Microsoft describes synchronized presenter interactions as a planned future improvement, not a current capability. Source: Teams behavior
For a guided session, tell attendees which option to select rather than assuming your selection has propagated. For self-paced exploration, independent state is useful because people can inspect different parts of the slide.
There are also presentation-mode differences. Windows, web, and iPad support interaction in both presenter view and slide show. Mac supports it in slide show, but not presenter view. On Mac and iPad, other content placed on the same slide appears behind the interactive content because the experience is optimized for a full slide. Source: presentation modes
Microsoft documents keyboard access through Tab, visible focus indicators, and Esc to return focus to PowerPoint. Left and right arrows remain slide-navigation commands. Some keyboard behavior differs on Mac and web, with further improvements planned. Source: keyboard navigation
A useful rehearsal should therefore test the actual delivery environment, keyboard operation, and the non-interactive fallback. A PDF should remain understandable even when its filters, tooltips, and detail panels cannot be used.
When a presentation is reopened, interactive slides return to the starting layout established when they were created or last updated through Copilot. Interactions may remain reflected while the file is open, but should not be treated as durable saved application state. Source: reset behavior
Before presenting: validate content and behavior separately
A polished surface can make an incorrect result feel authoritative. Review two layers independently.
Content review
- Reconcile displayed values with the supplied workbook or document.
- Verify units, denominators, dates, product names, and technical labels.
- Separate source facts from generated explanations or illustrative additions.
- Review speaker notes as carefully as visible content.
Behavior review
- Exercise every filter, tab, slider, and navigation control.
- Check that selected state, charts, totals, and detail panels agree.
- Test empty selections and boundary values where applicable.
- Confirm that essential information is not available only through hover.
- Reopen the deck and inspect its starting state.
- Test the target presentation client and static export.
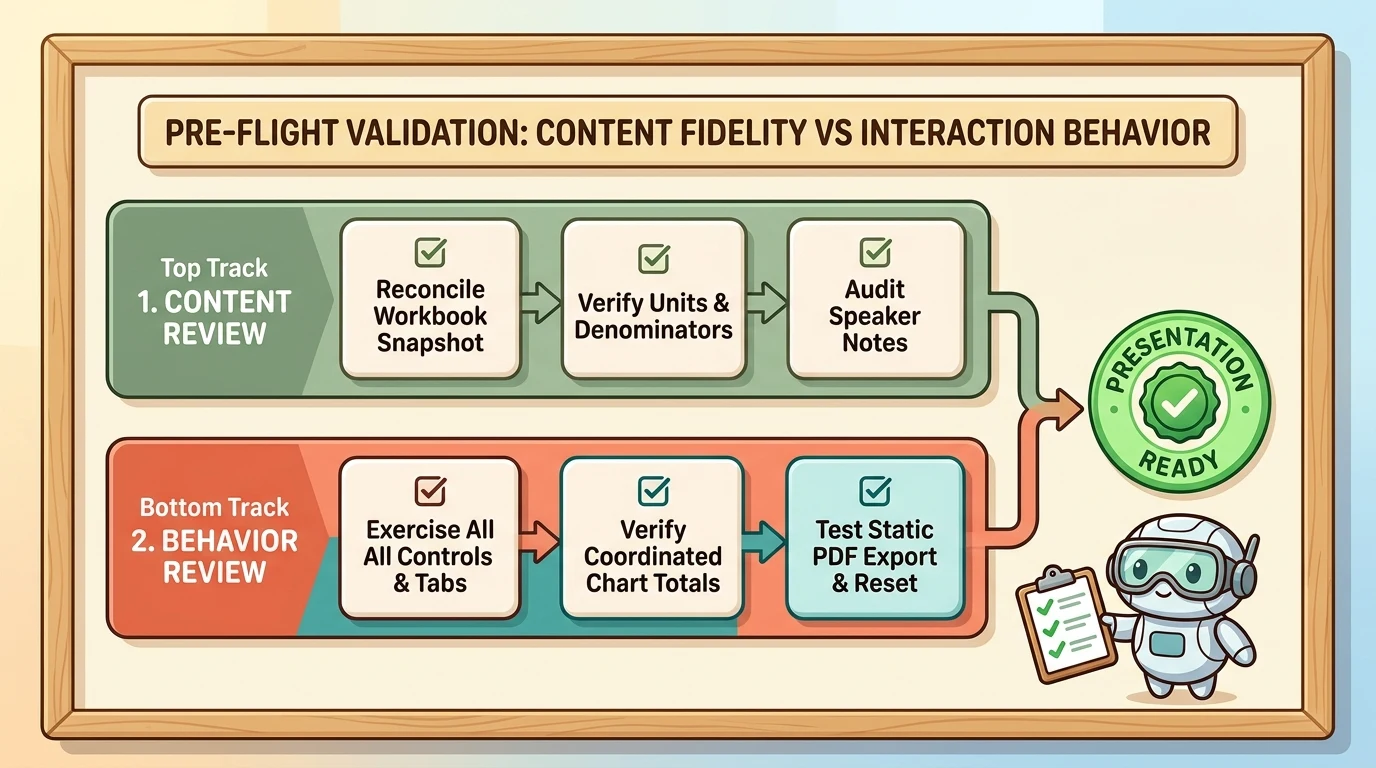
These are editorial and testing recommendations. They follow from the feature’s documented AI-generation risks and platform differences, rather than implying a built-in validation system.
The real opportunity: make the question part of the slide
Interactive slides are most useful when a static slide would otherwise need too many labels, too many variants, or too many follow-up slides to explain the same relationship.
A dashboard lets the audience choose a segment. A diagram lets them inspect a component. A timeline lets them select an event. A teaching model lets them explore an assumption. In each case, the interaction should serve the explanation.
Start with one audience question, one reliable source, and one meaningful control. Verify the facts, test the behavior, and rehearse in the environment where the presentation will be delivered.
The goal is not to make every slide behave like an application. It is to make the right slide answer the next question.
Read next